Adrien Ruggiero
Artificial intelligence and data science enthusiasts, my ambition is to become a data scientist. I love to get involved in data science projects on projects that interest me.
View my LinkedIn profile
Brain Tumors Classification
1. About this project
Everything is explained in the pdf file named “ProjectReport”. However, as it is written in French, this README file will explain the main points in English. The code is available here. Let’s start with a short presentation of the different files:
- Folders
- A directory with random images taken from the internet : MoreData
- A directory created automatically during the execution of the code that will partition our dataset : brain_tumor_dataset
- Files
- Our French report delivered as part of this school project : ProjectReport.pdf
- Our model trained and saved without Data Augmentation : model_trained_noDA.h5
- Another model, trained this time with Data Augmentation : model_trained_augmented.h5
- All the requirements needed to execute the whole jupyter notebook : requirements.txt
This project was done in a school context with two other classmates. The scope and the subject were free. We decided to specialize more specifically in Deep Learning to have this first experience instead of doing only a Machine Learning project with regression or classification as the rest of the class was doing. In addition to that, we chose a topic related to the medical field because we are interested in these applications and are clearly interested in pursuing a career in data science applied to medicine.
2. Dataset
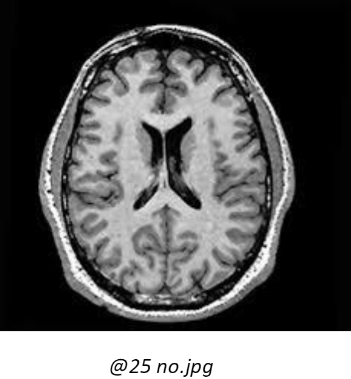
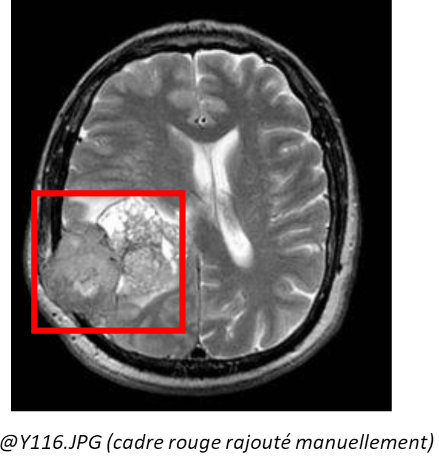
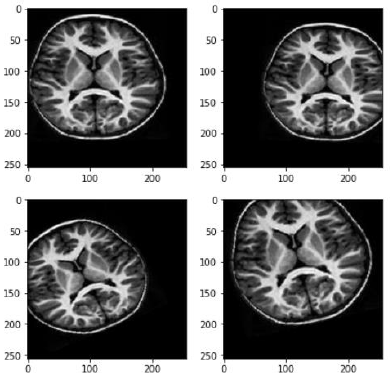
The data comes from a training set made available on Kaggle, more precisely at the following address: https://www.kaggle.com/datasets/navoneel/brain-mri-images-for-brain-tumor-detection There are 253 images available, mainly in .jpg format, although .jpeg and .png are also available. In these images, there are two categories, namely images showing a brain tumour (Yes: 155) and images with no tumour (No: 98). They are all in grayscale. Some additional criteria are noted:
- The images do not all have the same dimensions. Both on the ordinate and on the abscissa.
- For similar areas, the light intensity of the pixels varies
3. The process
Here are the different stages of our reflection:
- The dataset is divided into 3 parts: training (70%), validation (20%) and testing (10%)
- We normalise our images to be able to compare them by positioning them on the same range of values (which will speed up the processing of the CNN at the same time)
- We resize all the images to provide them as input to the CNN and to speed up the processing once again
Then, we build our CNN with the following 5 layers
- Conv2D: this layer produces as many feature-maps as it is composed of neurons. Each feature-map has different characteristics of the image.
- BatchNormalization: often placed between two layers, it allows us to normalize the values taken as input to improve the processing of the next layer.
- MaxPooling2D: this layer aims to extract trends or patterns from the data. It will therefore extract the maximum value in order to keep only the important information of each input feature map.
- Flatten: its objective is to flatten the input tensor to a vector and thus one dimension: 1-D.
- Dense: each neuron in this layer receives input from all the neurons in the previous layer (fully connected). It is a layer that predicts the membership of a category from the outputs of the previous layer.
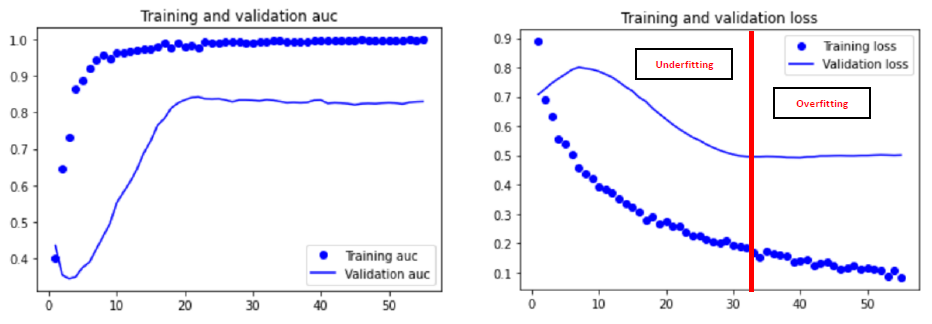
In order to avoid overfitting, the principle of early stopping is also used. Here are the compilation parameters of our model for its evaluation :
modelCNN_examp.compile(loss='binary_crossentropy', optimizer=optimizers.SGD(lr=1e-4), metrics=['AUC'])
4. Different methods to further our thinking or improve our model
- Data Augmentation : DA
Our dataset contains little data, so we sought to increase it. A simple procedure is to use Data Augmentation (DA) which artificially modifies some of the images in our training dataset to increase the amount of data to be trained. In addition to augmentation, this allows us to diversify the data without actually collecting any. Finally, the objective is to limit overfitting since our CNN will consider the generated images as distinct.
Here are all the transformations applied to our images:
- Rotations of the image
- Vertical flips
- Horizontal flips
- Zooming the image
- Cropping the image
CAUTION: it is necessary to limit the effects of these transformations so as not to modify the image too much.
Indeed, a combination of zooming, cropping and rotation can cause us to lose our point/area of interest within the image, namely the tumour, in particular by cutting out the part of the brain where it is located. This can result in an image being considered tumour-free when in fact it is labelled as having a tumour, thus adding false negatives.
- Repetition and comparison of models
We carried out a manual cross-validation in order to compare several models. We studied 4 cases, namely a model with the ‘Adam’ optimizer and a model with the ‘SGD’ optimizer, with one case without DA and one case with DA. In order to make the results more relevant, we decided to repeat these experiments about ten times. This will give us an idea of which configuration represents the best model.
- Confusion matrix
We use the confusion matrix to retrieve some additional metrics including recall. In our model, we consider the images bearing a tumour as our relevant element. Recall will therefore tell us whether the set of people who need to be treated are identified, whereas precision will tell us whether we are treating people who do not need to be treated. We want to maximise our chances of treating all the people who have the condition, hence the interest in recall.
Also, we were interested in the ‘AUC’ metric rather than the ‘acc’ metric because it is more relevant to our study, particularly through the study of false negatives. Indeed, it takes into account the prediction probabilities for each class, and is more representative and robust for small datasets.
5. Results
In our case, the data augmentation was inconclusive. Therefore, for our final model we use the ‘SGD’ optimizer (generally better than Adam for small datasets) and without DA.