Adrien Ruggiero

Artificial intelligence and data science enthusiasts, my ambition is to become a data scientist. I love to get involved in data science projects on projects that interest me.
View my LinkedIn profile
WebApp_NBAStats
Everything is explained in the pdf file named “ProjectReport”. However, as it is written in French, this README file will explain the main points in English. The code is available here.
The code desing is divided in four main parts :
- An excel file NBA_data_R containing all the information of the NBA players
- A global file that allows to define variables that can be used in both the server part and the interface part (renaming, package import, etc…)
- A server file which will contain all the functions and actions proposed to the user (display, selection, etc…)
- A ui file which simply allows to create the interface available to the user
1. Origins and interests for the project
My teammate and I have an interest in sports and especially in the NBA. That’s why we decided to study the salaries of the players according to their sports performances.
Seeing the astronomical salaries of many players, we asked ourselves for the data collection and storage project:
To what extent does the sports performance of the players affect their salary?
Unfortunately, as a result of the health crisis, the seasons were disrupted, so we had to revert to a so-called “regular” year. Therefore, we will be looking at the regular season for the 2018-2019 year.
2. Project Description
The purpose of our application is to display and study descriptive and sports statistics related to players and teams.
It gives the possibility to compare the NBA players and get an idea of the relative level between them.
There are 4 pages in our web app :
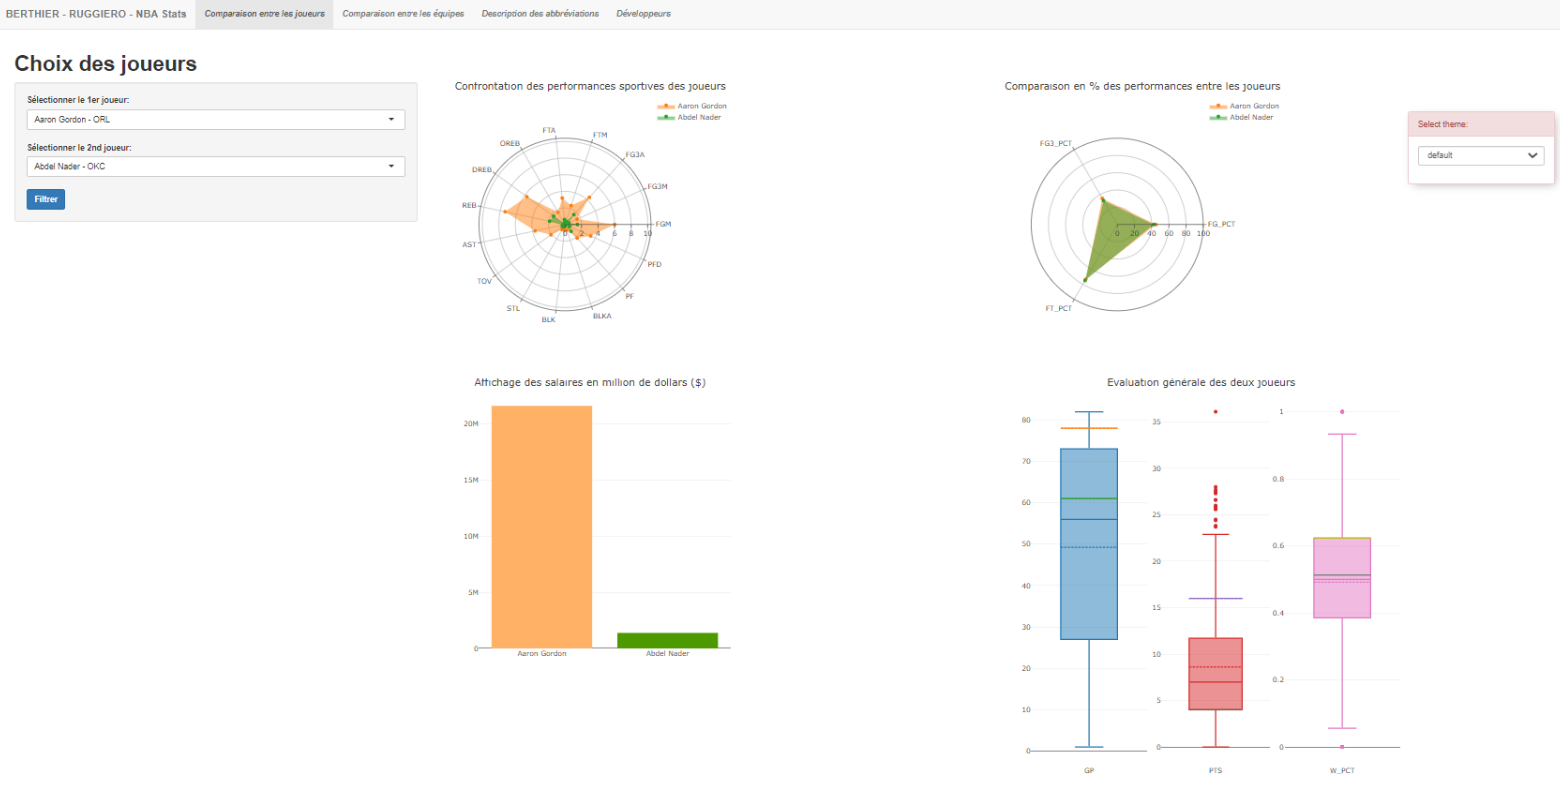
### 1. Players Comparison
In the first page, we compare two players from a statistical point of view.
Of course, it is possible to select only one player to study only his performance.
We can compare palyers through several charts:
- A Kiviat diagram for the performances during an established match
- A second Kiviat diagram for the performances established with percentages
- A histogram that displays the salary associated with each player
- Whisker boxes to position the players in relation to the globality of our of our data set
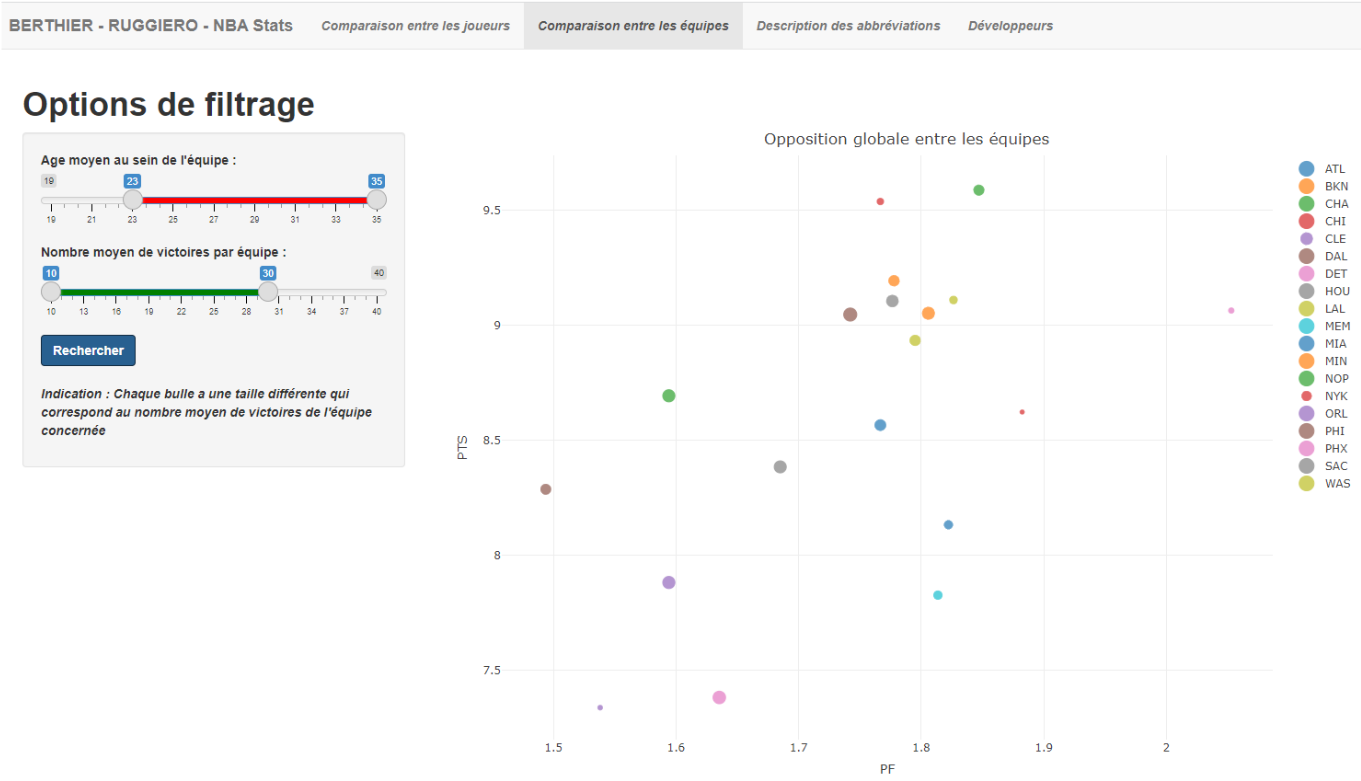
### 2. Teams Comparison
In the second page and after focusing the palyer scale, we want here to retrieve statistics of NBA teams in order to compare them.
To do so, we take the statistics of the players attached to the same team and we average each of the characteristics to have the same basis for
comparison. Note that taking the mean was arbitrary and other methods could be performed to achieve these comparisons of teams.
Our graph is a bubble chart that will position the teams in a space according to two characteristics. In parallel to the two characteristics, we give the user the possibility to filter the teams and all the teams that do not belong to the conditions of these filters will not be considered for the display.
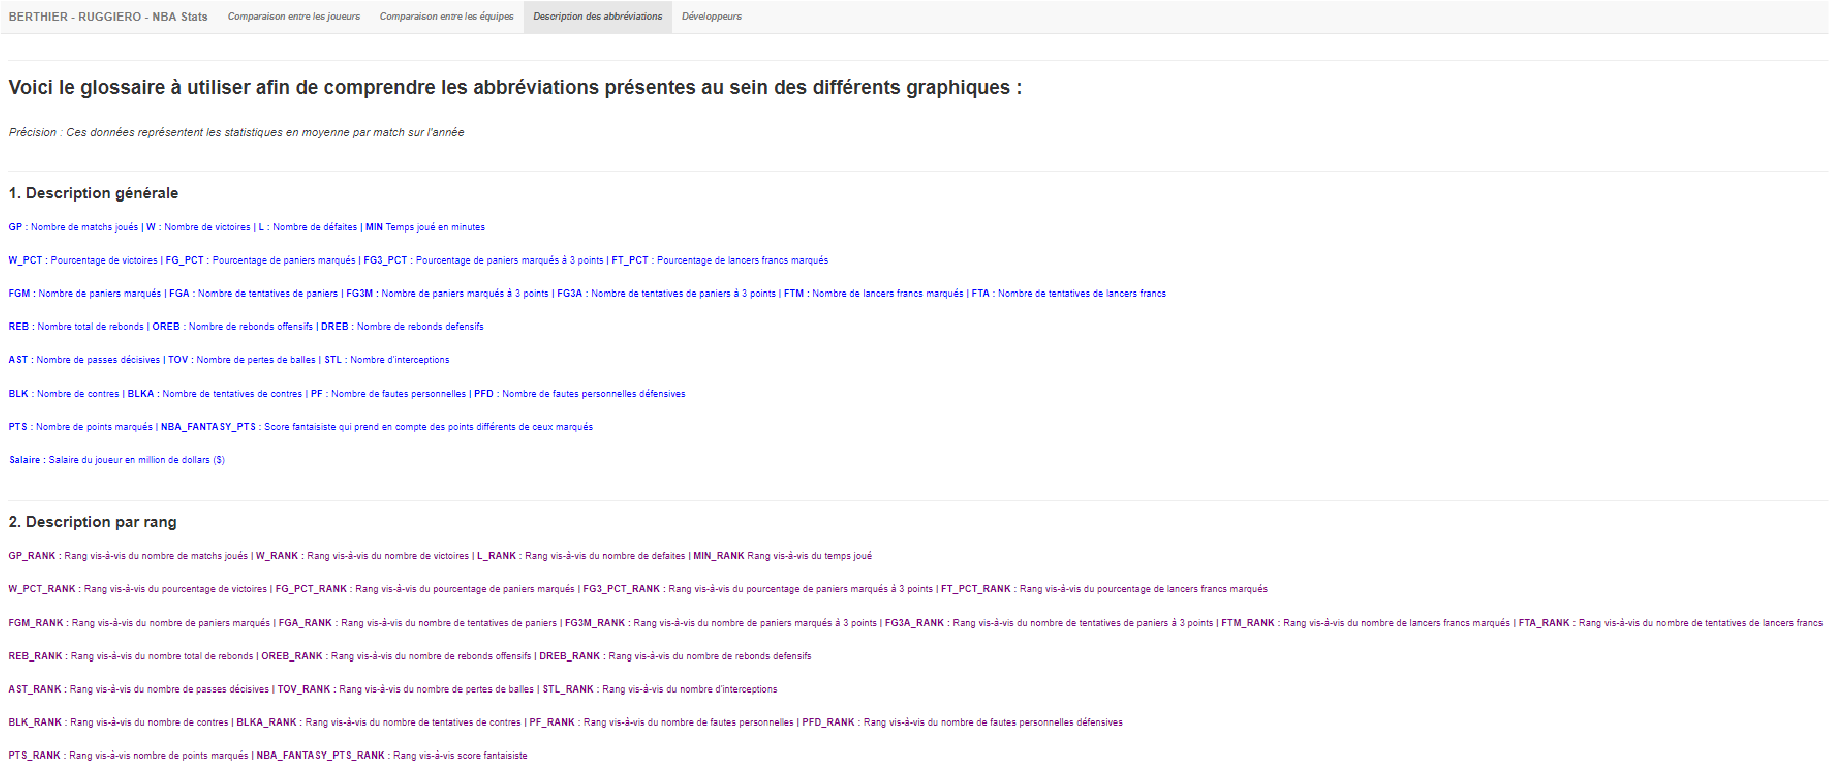
### 3. Data description
This page does not offer many features.
It simply allows the user to get acquainted with the language and lexicon used in the NBA world to define and categorize sports performances during different seasons.
In reality, it is a simple glossary.
3. Ways to improve our project
We are well aware that this project can be much more driven and complete. Indeed, this project was performed with a short deadline so we could go too deep in the app as the aim of this particular project was to understand the process of build a Shiny App.
As a consequence, this project could obviously be carried on. Here are some ideas on how to improve it:
-
Offer a part of machine learning with supervised learning supervised learning. Indeed we have labeled data and a regression problem (salary estimation). We can use linear regression as a learning model. To do so, we could have slightly restricted the number of characteristics by focusing only on some of them like the number of wins, the number of points, the number of successful and attempted shots, etc…
-
Diversify the analysis and possibilities by increasing the size of our data set. For this we could also have retrieved data from different seasons than this one, i.e. 2018-2019. This would have allowed us to study and compare the evolution of players and teams.
-
Retrieve a dataset containing the position of the players on the field during certain interventions (shots, passes, counter-attacks, etc…) to have a visual map as well as an idea of the distribution and positioning of the players during these actions
-
Improve the graphical interface by offering a more pleasant visual and more complete functionality
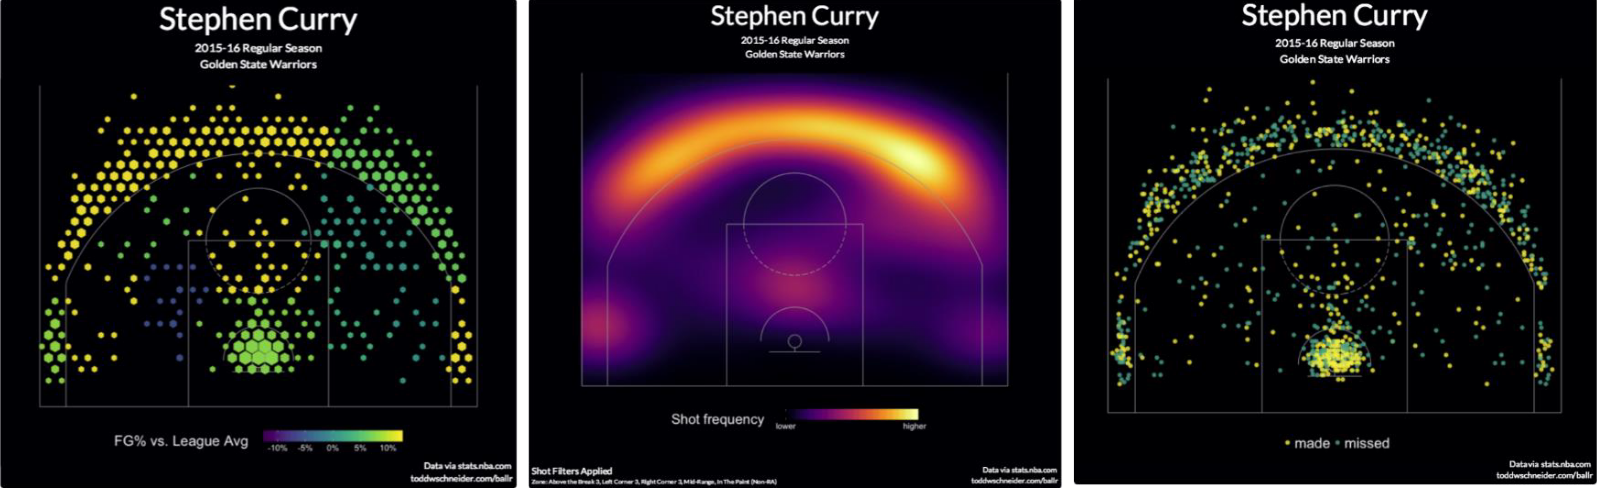
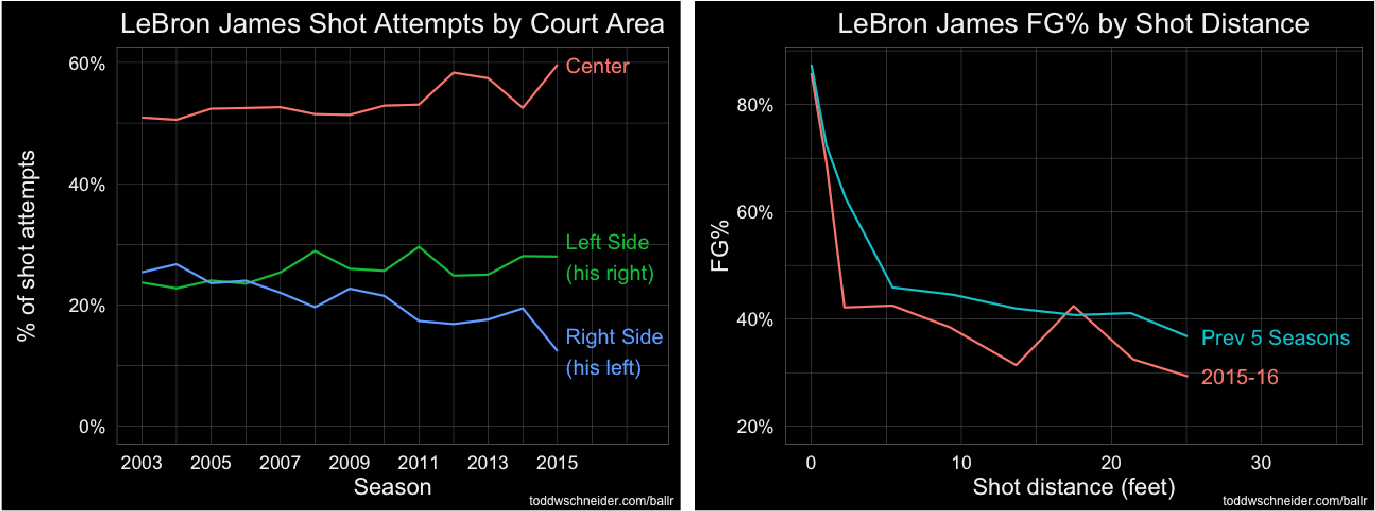 Source : https://toddwschneider.com/posts/ballr-interactive-nba-shot-charts-with-r-and-shiny/
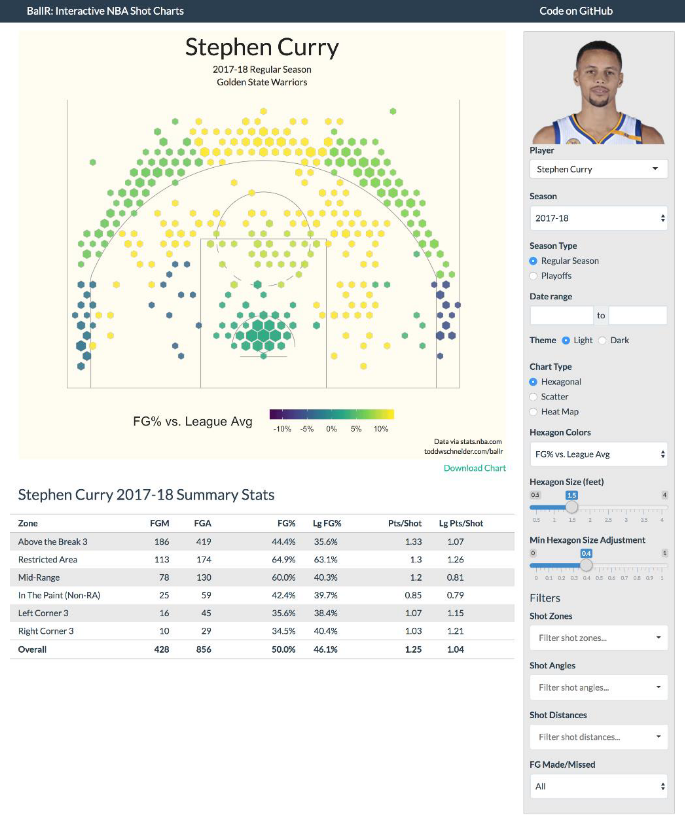 Source : https://github.com/toddwschneider/ballr